Technical Analysis: XOM
by Johnny DebacleWhen an observer with a trained eye looks at Exxon Mobil’s (NYSE: XOM) 3 month stock price chart, an interesting picture presents itself.
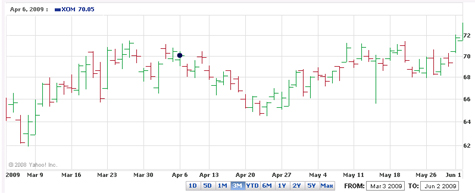
For those of you who do not have a CTA, you’d look at that and see a normal chart, nothing that screams “Trade Me.” But for those of us who are more gifted in the technical arts, we hear voices screaming in our heads saying “Buy Buy Buy” in the days surrounding April 20th. That’s because during that span of time XOM was trading within the “neck” range of a text book Bactrian Double Hump & Pump formation. Let me tease it out for you.
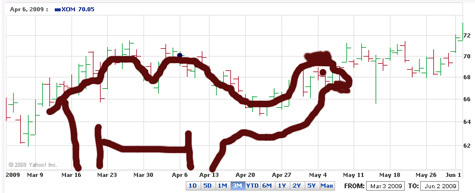
As you can see, the chart is clearly showing a picture of a two hump camel. And if you know anything about two hump camels, you know that when you are traveling from butt to head, after you clear the second hump their neck declines precipitously before a rapid ascent. If you can buy a stock in that desirable neck range, you are likely to experience a short term pop. This is a historically* proven tradeable phenomenon. Here is an overlay of an actual two hump camel:
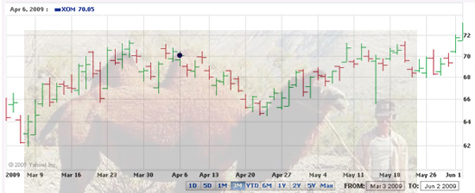
Aside from the neck, after you plateau in the head range you enter an uncharted area. The stock price becomes dependent upon whether the man holding the reins of the camel decides to jump or not, something that is unknowable to even the most gifted technical analyst.
*Definition of “history” employed in this context is not universally accepted, but is permissable under SAAP
Related Reseach:- How Inefficient Are Seals?
- Are Walruses Efficient?
- Stocks Stocks Stocks: Week in Review June 8th 2007
- Valuations Increasing on Attractive Farm Assets
- Empirical Proof, Camels Only Drink Coke
- Camels, The Next Big Thing
- The Corporate Tarpit: MOVI
Clearly my technical skillz are not up to your level, I’d mistakenly predicted a Submerged Brontosaurus Bounce, but got crushed on the 2nd hump
Phew. I’m glad that was a camel curve.
For a while there, I thought it was a Fat Chick Lying On Her Back Curve, but the rising scatter of data points on the right seemed anomalous. As everybody knows, when you recognize the Fat Chick Lying On Her Back Curve, the initial impulse is to go long because everybody loves a bull in the market, but then you catch yourself and go short, very short.
Thank goodness there’s a rational explanation for that and it only involves camel humps.
Pleb,
The absence of any Camel Toe clearly shows that it wasn’t a fat chick lying on her back. Although you’d really have to dig deep to find it, if it were.
wow
Also don’t forget that you have to close your position as soon as you get to the mansize tick, this is very important, because unless this is “the camel leaving in a nordic zoo pattern” this meaning the man is taller than the camel, there is a strong probability your trade will end up on the pound (read oasis) quickly.
Amazing analysis, but mostly these pairs are left untraded thanks to their impossible to predict nature, so unless we have great skills. It is not only impossible, but hard to maintain the accuracy levels. I mostly use currency pair where I get great advantages of low spread of just 0.2 pips with high leverage up to 1.500 and most importantly the conditions to do trading is ideal with almost 99.9% of the trading orders executed instantly without any requotes in any situation.