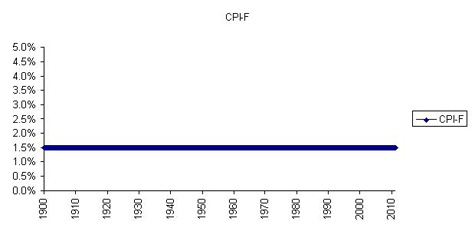
Announcing the CPI-F (flat)
by Mr JugglesThe WSJ’s Heard on the Street column is generally pretty good. So the title of a recent entry, “Housing Bubble Continues to Haunt Fed“, made me interested to hear adults talk about the current stagnancy in real estate and how the hangover from the bubble still lingers. But I didn’t hear any of that malarkey. Instead, I learned that people are debating whether housing plays too big a role in the CPI; specifically, the “problem” is that the housing portion of the CPI is exerting upward pressure on the overall number. Y’know because consumers typically live somewhere and pay for that privilege.
“OER [editor’s note: “owners’ equivalent rent”] is expected to jump to 1.2% year-on-year in December from 0.6% in February, despite a sluggish housing market.”
1.2%!! This is getting serious.
So what should we do?
“Some suggest alternative inflation measures.”
Oh ok. Well, what are “some” proposing?
“A ‘supercore’ alternative excludes not just food and energy but shelter, too, to gauge underlying trends.
There is great opportunity for the Govt to reduce CPI by excluding more items. In fact, this looks eerily reminiscent of another highly successful endeavor in metrics improvement: LoS’s change from GAAP to SAAP (Seldom Accepted Accounting Principles). By changing our standard, we could change our metrics, and by changing our metrics from EBITDA to EBE (Earnings before Everything aka “supercore earnings”), we greatly improved our profitability.
As visionaries in the SAAP space and masters in specious metrics, LoS would like to be included in the “some” who are suggesting alternatives ways to measure CPI. Considering that the evolved goal of the CPI is to show a slight and consistent level of inflation, we propose that the CPI no longer include any components that are increasing in price level more than 1.5%. These items will be increasing as a percentage of the index, thus throwing off its accuracy. Similarly, items that are increasing in price level less than 1.5% or even decreasing should also be excluded since a) we are not interested in deflation and b) the accuracy of the model depends on items maintaining a consistent (rather than falling) proportion of the total index. It’s important to note that any price changes greater or less than 1.5% could skew the whole thing we are trying to measure and render the CPI not just unreliable, but practically useless.
This new CPI, CPI-F (flat), will provide data on all changes in the prices paid by urban consumers for a representative basket of goods and services whose prices demonstrated a slight and consistent level of inflation. We expect it to have the most consistent and consistently low inflation readings of all the CPI measures. Its current reading is 1.5%. In the future, the monthly CPI-F level will be reported on the 5th of the following month, unless there is no change to the index, in which case you can continue to use the prior month’s reading. Here is a pro forma chart that demonstrates what inflation would look like as measured by CPI-F since 1900.

- Enriched Uranium Has Gone Nuclear
- New Non-SAAP Measure: EBE
- How Are Oil Prices Affecting You?
- New Treasury Product: TRP
- SAAP Notice on Fiscal Year End
- Dear Greenspan, Please Shut Up
- Long the Pantry
- Notice to Subscriberholders: Change in Accounting Principle from GAAP to SAAP
Surely if the prices of everything within the basket are by definition not changing, then the reading would be a continuous 0% ?
HAHAHAHAHAHAHAHAH! Good to have humor these days.
Unfortunitley I can’t tell if this is a joke or not
eat it, inflation. now you don’t exist for reals.
Just found this site… I’ve been missing out for years! Happy to see you have restarted.
RSS feed would be great 🙂
Stunning analysis as usual, gents. I like the way you think.
hi all, this is quite a good idea but i already do this! I just dont make it as obvious. look at all these things i removed from the index (link)!!! haha!!! it’s so great. My favorite is that i’ve basically excluded cheese from the index for a decade now!!!! hahah CHEESE!!!!!! that is soooo funny!!
http://www.stats.bls.gov/cpi/cpisaia04.pdf