Archive for the 'Financials' Category

New Non-SAAP Measure: Net Tweetcome-based Valuation

Long or Short Capital was the first firm to switch its accounting to SAAP. LoS further improved accounting when it added Earnings before Everything (EBE) to the SAAP lexicon. The results are that SAAP is ubiquitous and it’s now quite common for public companies to exclude most expenses when reporting earnings.

After delivering those innovations and after switching to the “royal we”, we looked at potential disruption in the accounting space and started yAccountingStars, an accounting accelerator. We hired hordes of hungry hipsters, who were willing to work for almost nothing so long as we promised them beanbag chairs, organic coffee, and a good work/work balance. We also lied and told them they’d all get equity. (Please don’t txt or tweet this to them, they don’t actually read anything that isn’t a txt or a tweet, so this is safely between you and us here.)

We then asked ourselves: what investor pain-points can we help solve? what kind of onerous constraints does accounting impose? Investors already get SAAP, given that 80% of companies employ SAAP according to a study we might have done. Investors also firmly grasp the value of companies with no reported net income but ample EBE. But what about companies that have huge opportunities but negligible revenue but also have a vigorous twitter account? Why should these companies be left behind?

Following years of R&D and inappropriate workplace behavior at yAccountingStars, LoS is ready to throw such companies a lifeline and introduce Net Tweetcome and Price to Net Tweetcome (P/NT). Net Tweetcome is calculated by taking a CEO’s tweets and then deducting all expenses associated with those tweets. Mathematically (for all the nerds* out there who care about the actual calculations behind made up numbers) this is represented as:

Tweets - 0 = Net Tweetcome
P/NT = Price / Net Tweetcome

Example: Suppose you are an investor trying to find value in the consumer internet space. There are some companies that have been public for ages like Priceline (PCLN). Then there are newer, Up-and-Comers like Grubhub (GRUB), Zillow (Z), and Yelp (YELP). Which should you buy? A traditional analysis might be based on P/E:
PE

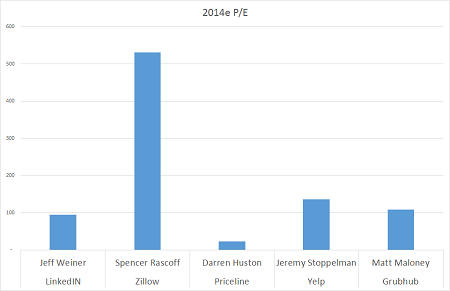
Even though we are using pro forma, EBE-style EPS estimates that exclude all kinds of normal expenses (for instance, the large portion of employee compensation that happens to be paid in stock), the Up-and-Comers carry ridiculous valuations; only Priceline appears to be reasonable. But investors need to own these hot Up-and-Comers…in size. P/E valuations fail us here.

What’s the solution? (spoiler alert: it’s Net Tweetcome):
P 2 NT
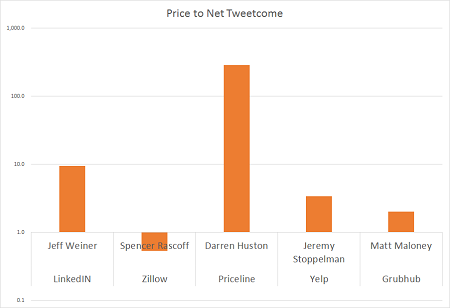
Note that we have chosen to display this comparison on a logarithmic scale in order to convey a false sense of precision and general maths capability.

P/NT shows that Priceline actually sports the loftiest and most dangerous valuation. While many of the Up-and-Comers sport quite attractive valuations. Zillow is positively cheap on a P/NT basis. Thanks to CEO Rascoff’s unprecedented 5.8 tweets per day, Z looks like a value buy for a progressive analyst capable of spotting their strong fundamental Net Tweetcome. To underscore how cheap it is, if Zillow traded at the same P/NT multiple as Priceline, it would be worth $3.4 trillion dollars and a prospective investor would be served a delicious 65,327% return from today’s trading level. And just think if Rascoff starts live-tweeting all his favorite TV shows: Z could go straight to Perf.

Recommendation: Long Twitter. The gap between reality and Net Tweetcome is highest at Twitter itself. On traditional metrics, is confusing. For instance, in 2013 Twitter managed GAAP net loss of $645mm on revenue of $665mm for a net income margin of negative 97% while, on an EBE basis, they lost $35mm. These are impressive results in their own right; it’s not easy to lose that much money 140 characters at a time. But look…Twitter sent over 200 billion tweets in 2013! That means Net Tweetcome = 200bn tweets – 1.3bn opex** = 198.7bn. That is the highest Net Tweetcome in the world! Twitter is trading at 1/10th of annual Net Tweetcome…we have literally never seen this type of opportunity before and are up to our necks in fictional Twitter stock!

If we can rein in their Tindr activity, we are confident yAccountingStars will have their next report “How to Calculate the Tweetcome TAM for Any Company in 14 Easy Steps” ready shortly.

*Only nerds read footnotes, you nerd.
**Yes, we previously defined Net Tweetcome as “Tweets – 0” but Twitter is the exception that proves the rule. Given that they actually bear the costs to send all tweets, we must dock their Net Tweetcome with operating expenses.


Long or Short Capital Audit for Fiscal Year 2008

Submitted by user Bean Counter

To the Board of Directors and Shareholders
Long or Short Capital, LLC

We have audited the accompanying balance sheets of Long or Short Capital, LLC as of December 31, 2008 and the related statements of income, retained earnings, and cash flows for the year then ended. These financial statements are the responsibility of the Company’s management, despite repeated claims that the responsibility lies with TARP, TALF, ALF and various other entities and bailout programs. Our responsibility is to express an opinion on these financial statements based on our audits and to enjoy the frequent perks and privileges that management provided us with by utilizing the suspended dividend payments. We conducted our audits in accordance with the lessor of SAAP or auditing standards generally accepted in Zimbabwe (GAAPIZ). Those standards require that we do absolutely no planning, and that we perform the audit to obtain reasonable assurance about whether the financial statements are printed on some form of paper. Preferably recycled paper, as to appear “green” and encourage further investment. This audit includes examining, on test basis, evidence supporting the amounts and disclosures spent by management in “getting it done.” An audit also includes assessing the lack of principles used and significant estimates made by management, as well as evaluating the overall financial statement presentation to make sure that it “looks pretty.” We believe that our audits provide a reasonable basis for our opinion. In our opinion, the financial statements referred to above present fairly, in all material respects, the financial position of Long or Short Capital, LLC as of December 31, 2008, and the results of its operations and its cash flows for the years then ended in conformity with the lessor of SAAP and accounting principals generally accepted in Zimbabwe (GAAPIZ).

Bean Counter & Associates


Suspension of Dividends

Like most of you, Long or Short Capital is not entirely immune from the current dislocation going on in capital markets. Also like most of you, Long or Short Capital recognizes that this period of extended dislocation and, more generally, the backdrop of the Great Regression, provide the perfect cover for past acts of corporate malfeasance and accounting shenanigans.

The good news is that you, as subcriberholders under our former dividend policy, have been compensated both in the form of money, and in the form of insightful investable recommendations. But there is bad news. Due to the current capital market uncertainty, especially the difficulty we have encountered in trying to secure a revolving line of credit so that we are able maintain sufficient liquidity, as well as the difficulty we have had in finding (entirely theoretical) potential debtor-in-possession financing (seriously we aren’t going to file, we swear on Madison’s life), we have entered into a cash conservation mode. We will be suspending our dividends, retroactively and futurely.

We have hired a financial advisor to explore our options both with respect both to our capital structure and to maximizing value to our executive team. We have them looking into the appropriateness of soliciting reverse dividends from our subscriberholders so as to improve our liquidity and ease the burden of certain off-balance sheet arrangements that were undertaken to finance my yacht (sometimes referred to as “the corporate yacht” in our filings), as well as my summer yacht.

We appreciate your continued support in these trying times. Personally, I think you can relate to the humiliating devastation I feel as I am forced to go from one mega-yacht I purchased due to my excessive compensation as CEO, one company yacht (in name only, I used it exclusively), and one summer yacht paid for by embezzling LoS capital funds, to only one mega-yacht.

For updates on our dividend policy, always navigate to our Dividend Policy. Thank you.


SAAP Notice on Fiscal Year End

Long or Short Capital released this press release this morning:

Long or Short Capital Management intends to stop messing around and realign our fiscal year end with the calendar year end. The confusion the previous misalignment created allowed management to manipulate the firm’s financials and allowed us to report our earnings in such a way as to maximize our compensation. Despite these obvious positive aspects of the previous year end policy, we have also found that maintaining mildy accurate records that correspond to these dates to be slightly hard. This is, as far as we and our consultants can tell, “slighty hard” too hard given our endowments of work ethic and of managerial competence. Thus our new fiscal year end will be December 31st, and we will restate all of our numbers correspondingly in conjunction with the release of our fiscal year 2007 numbers. This does not and will not affect the level of dividends we have granted in the past and no refunds will be given; any such requests for refunds or compensations will be handed off to our counsel, Google Trash and Can. Subscribers will be able to collect their new dividends when we announce them and their onerous conditions. We have checked with our accountants and advisors, and they have informed us that everything we intend to effect is fully compliant with SAAP standards. The management of Long or Short want to thanks our subscriberholders for their continued support in this non-difficult time for the company and also for allowing us to pad our pockets and line the hull of our mega-yachts with carbon fiber. Good day, sir.


Funding Dividends with Dividends

Felix Salmon’s Market Moves blog has seen the light and has created a one-off pseudo dividend policy for his readers, loosely modeled off of Long or Short Capital’s own dividend policy.

This is actually the eighth quarterly dividend that Long or Short Capital has paid, which is all the proof I need that this is an excellent business model. Readers of Market Movers are therefore hereby invited to send an email to blogonomics@gmail.com, stating the payment that they wish to receive. At the end of this week, the senders of the five lowest bids will receive the sum they requested via PayPal.

While others may pratter on about game theory or strategy, LoS will not bore you to death with any such thing. We submitted a completely dominant bid that will likely out dominate all other bids. Furthermore, in collecting this dividend we can offset our own substantial divident costs and use the money saved to make investments which will generate substantial returns.*

*Disclosure: These returns are contingent on actually making such investments, which LoS has yet to actually do. LoS modeled returns remain substantial and will continue do to so. If LoS modeled returns start becoming insubstantial, LoS will adjust LoS’s model accordingly, until such insubstantial returns are made to be substantial.


Long or Short Capital Announces Q4′07 Dividend of $0.80

Long or Short Capital’s third quarter of fiscal year 2007 closed on July 31st, 2007. After reviewing our financials, we have determined that the quarterly dividend will be at the formula level of $0.80 per a subscriberholder as of 7/31/2007. To qualify, all you need to be is a subscriber, either by XML or E-mail, as of 7/31/2007. If you were not, you will not be eligible.

For more information on how to collect your cash or cash equivalent dividend for Q4, please refer to our Dividend Policy. Given our float of 1216 subscriberstakes (as of 7/31/2007), a 5% growth assumption and our trailing twelve months total of dividends of $3.78 per subscriber, our current capitalization is $241,315 using a dividend discount model.


Long or Short Capital FY’07 Results

Top Articles from the Fourth Quarter

  1. How to Say All Their Money is Gone
  2. Motivated Prostitutes, the Opposite of Lazy Unions
  3. Zimbambwenomics and Mugabe Efficiency Theory
  4. If Only Water Wasn’t So Fattening
  5. The Ring of Greenspan
  6. I’m Calling the Top, today. My ten signs
  7. Vegetable Arbitrage

Top Articles from the Third Quarter

  1. Four Simple Steps to Becoming a Thousandaire
  2. Jacob, Son of Isaac, the First Value Investor
  3. Adjusted GPA on a Pro Forma Basis
  4. Pomegranate Capital Thinks Women Can Run Money Better Than Men, Is Wrong
  5. Crazy Person or Bluetooth Headset?: The Home Game
  6. The Market, She’s a Bitch
  7. Dogs Can Smell Fake DVDs and Other Malaysian Lies

Top Articles from the Second Quarter

  1. Vertizontal Consolidation
  2. Stop Global Warming, Make Emissions More Delicious
  3. 2×2 Matrix: Less is More
  4. Accounting in My Refrigerator
  5. Joe Theismann Presents Monday Morning Investing
  6. Critical Mass Supplier
  7. Kaiser Falcon Eyes

Note that the financials below are unaudited and may contain non-GAAP measures. All numbers comply with Seldom Accepted Accounting Principles (SAAP).

Unaudited Financial Results for FY’07
Income Statement

Contextual CPC Revenue $861
CPA Revenue $236
Static Ad Revenue $2483
Other Revenue $84

Total Revenue $3668

Cost of Sales $78
SAAP Income $3437

Balance Sheet

Cash $2914
Accounts Receivable $463
Inventory $0.00
Prepaid Marketing/Hosting/Reg $142
Accounts Payable $0

Cash Flow Statement

Operating Cash Flow $3146
Capex $0.00
Dividends $X.00

Performance Metrics

Visits 247,156
Pageviews 509,143
Clicks on ads 1224
Subscribers by Email 195
Subscribers by XML 1021
Technorati Rank 36,949
Inbound Links per Google ~403 sites
Google PageRank 5

Past Results (due to our reliance on SAAP, previous unaudited financial results are not reliable)

Long or Short Capital Q1’07 Results
Long or Short Capital Q2’07 Results
Long or Short Capital Q3’07 Results
Long or Short Capital Q4’07 Results


Long or Short Capital Reports Q4’07 Results

Long or Short Capital’s fiscal 4th Quarter ended on 7/31/07, and the company reported its results in a press release:

Mr Juggles: “Greetings. We like numbers because they are objective. As the saying goes, opinions can lie, but numbers can’t. So let’s start the call off with some numbers. Number of quarters in Long or Short history with more revenue than Q4 2007? 0. Q over Q revenue growth? 850%. Q over Q traffic increase? 360%. As you are accustomed to hearing, this quarter was our best quarter ever by any metric, even made up ones like Mugabe references per a perf words.

The actions collectively taken in the third quarter, paid off handsomely. If you were to make a list of what we set out to achieve you could probably check off every single thing; we actually tried to do this but we found out that the list we wrote everything down on had been lost. We are working on this, and know that we take keeping track of lists to be among our top focuses in H1’08.

A lot of our subscriberholders have been concerned about our accounting situation and our delayed delivery of our Q and K. Let me tell you, we have been concerned too which is why we have mostly been ignoring the situation and hoping that it would go away. This did not turn out to be an effective solution and we are still having unable to reconcile our trailing quarterly results with our fiscal year results. What we did find out is that this situation is entirely consistent with SAAP, and thus, it is no impediment to filing.

Ssiztah, SSST, our measure of organic traffic, grew 19% sequentially, compared to only a 5% sequential improvement in Q3. Our proprietary “Eyeball Monetization Conversion” ratio, a non-pageview measure of revenue generated per customer, rebounded to $15.56 after dipping to $14.49 in Q3, as we the gains we picked up in text link ads more than offset our losses in referral revenue. Our EMCr increased 110% compared to Q4 2006.

Earnings per subscriberholder was $0.99 and we think the $0.90 to 1.10 level is sustainable. Despite its sustainability, we still expect to beat that going forward. That is how we do. We generated $1209 in revenue for the quarter, and as I mentioned earlier, that was an 850% increase year over year. The upside in our business is largely leveraging traffic growth over our advertising.

We see some additional opportunities for growth in text link ads which are not sensitive to traffic swings, but we expect short term volatility due to operational issues with one of our text link ad suppliers (Text-Link-Ads.com). Their ads are not functioning properly, and the vendor has been unhelpful and disinterested in assisting our tech team in rectifying the issue; our last 5 e-mails have gone unanswered. This is the same vendor who has in the past sold our ads on a discounted basis, without permission, at permanent and unalterable rates.

This pricing strategy of theirs is antithetical to our strategy of planning for future growth. Given their contractual 50% share on the revenue the ads they place generate from our site, this represents a fire sale of valuable site real estate. We are 100% against discounting and have no intentions to be a discount provider of satirical financial research. As such, we are actively exploring discontinuing our relationship with this ad vendor due to the fact that they are “sneaky terrible”.

Long or Short is as ad saturated as we are comfortable with. Our comfort level, in regards to this, is dependent on opportunities for marginal revenue and is, frankly, easily swayed. We do expect a pickup in CPA initiatives as the holiday season approaches, but the form of those initiatives has not firmed yet.

Our subscribership increased from 1012 to 1206. As could be expected, our FCF decreased to $1,026, after last quarter’s timing boosted $1,417. As to the excess cash we had on the balance sheet at quarter end, because of some accounting fraud issues we are finding that the best use of the cash on the balance sheet will almost certainly be on acquiring an appropriately prestigious corporate pen. We are still exploring what corporate pen is most consistent with producing the levels of prestige commeasurate with what Long or Short Capital subscriberholders would expect. Additionally, we expect the accounting fraud issue to have an impact of well under one million [inaudible] and as such, we do [inaudible] to get into it further.

Returning to the metaphor I used on the last call, we were that 7 coming out of college, and we spent Q3 and Q4 exercising, investing in our wardrobe, blonding our hair and not-eating three healthy meals a day. Now we are a 9 and everyone wants us. The question is, what do we do now that we have successfully transitioned? The answer? We embark on a career as a CNBC or Fox Business News reporter or anchor. With our ten cent head and our million dollar body, this is our clear next step and Long or Short is pursuing this to its fullest. We will update you on our efforts in this vein on our next call. Thanks and let me say on behalf of management that we will continue to make ‘Long or Short Equity Ownership Experience. â„¢’ as amazing for you as it is has been for our yacht collection.”

Top Articles from the Fourth Quarter

  1. How to Say All Their Money is Gone
  2. Motivated Prostitutes, the Opposite of Lazy Unions
  3. Zimbambwenomics and Mugabe Efficiency Theory
  4. If Only Water Wasn’t So Fattening
  5. The Ring of Greenspan
  6. I’m Calling the Top, today. My ten signs
  7. Vegetable Arbitrage

Top Articles from the Third Quarter

  1. Four Simple Steps to Becoming a Thousandaire
  2. Jacob, Son of Isaac, the First Value Investor
  3. Adjusted GPA on a Pro Forma Basis
  4. Pomegranate Capital Thinks Women Can Run Money Better Than Men, Is Wrong
  5. Crazy Person or Bluetooth Headset?: The Home Game
  6. The Market, She’s a Bitch
  7. Dogs Can Smell Fake DVDs and Other Malaysian Lies

Note that the financials below are unaudited and may contain non-GAAP measures. All numbers comply with Seldom Accepted Accounting Principles (SAAP).

Unaudited Financial Results for Q4’07
Income Statement

Contextual CPC Revenue $283
CPA Revenue $7
Static Ad Revenue $891
Other Revenue $28

Total Revenue $1209

Cost of Sales $19.55
SAAP Income $1190

Balance Sheet

Cash $2914
Accounts Receivable $463
Inventory $0.00
Prepaid Marketing/Hosting/Reg $142
Accounts Payable $0

Cash Flow Statement

Operating Cash Flow $1032
Capex $0.00
Dividends $X.00

Performance Metrics

Visits 77,671
Pageviews 157,529
Clicks on ads 491
Subscribers by Email 195
Subscribers by XML 1021
Technorati Rank 36,949
Inbound Links per Google ~403 sites
Google PageRank 5

Past Results (due to our reliance on SAAP, previous unaudited financial results are not reliable)
Long or Short Capital Q1’06 Results
Long or Short Capital Q2’06 Results
Long or Short Capital Q3’06 Results
Long or Short Capital Q4’06 Results
Long or Short Capital Q1’07 Results
Long or Short Capital Q2’07 Results
Long or Short Capital Q3’07 Results

Also here is a look at our Google Spreadsheet Financials spread out quarterly. As you can see, we strictly adhere to SAAP.


Long or Short Capital Announces a Delay in Filing Fourth Quarter Financials

Long or Short Capital will not be able to file its financials at this time due to several accounting irregularities which have been brought to our attention. Chief among them is an issue concerning our cash balances. Our cash on our quarterly basis does not line up with our annual changes. As you know, according to SAAP, this is a problem that can usually be cured by merely choosing which number seems more appropriate. Other solutions include “making it up” or “embezzling the difference.” To ensure that we effect the best possible outcome for Long or Short and its subscriberholders, we plan on retaining the services of an external accountant who is fully versed in SAAP and can advise us on the proper steps to take.

We assure you that we do have cash (somewhere) and that there will be at most a $1 million change in our cash balance as a result of these irregularities. Based on all the Qs and Ks which we have read, $1 million isn’t much, so there is no reason for concern. We appreciate your patience in waiting further for our financials.


Long or Short Capital Reports Q3’07 Results

Long or Short Capital’s fiscal 3rd Quarter ended on 4/30/07, and the company reported its results in a press release:

Mr Juggles: “Morning all. The third quarter was a transitional one for Long or Short. We took part in initiatives which had a negative short term impact on our financials, but which will position us for a higher level of long term sustainable earnings. Additionally, we put less focus on unadulterated traffic growth and more focus on user interaction. Lastly, we worked with our customers to squeeze working capital down to more efficient levels to drive cash flow. Any quarter would have been disappointment following the milestones we were able to blow out of the water in Q2’07, but I am proud to say that I think management proved in Q3 that we will not pander to short term financial metrics, unless it will increase value to subscriberholders, in which case we will pander to short term financial metrics.

Sequential same store traffic, our measure of organic traffic, showed a 5% positive trend against Q2. Considering that last quarter was our historical peak, it means this quarter is now our historical peak, and this is, clearly, historical. Our proprietary “Eyeball Monetization Conversion” ratio, a non-pageview measure of revenue generated per customer, decreased from $18.43 to $14.49, expected due to a scale-back in static advertising and other strategic initiatives which I will address later. Our EMCr still improved 67% on a year over year basis.

We generated earnings per subscriberholder of $0.91 compared to $2.12 in the second quarter and $0.60 in Q1. We generated $947 in revenue for the quarter, a 685% increase year over year, and slightly down sequentially. Our dosey-doe with Google Adsense and Yahoo Publisher resulted in yet another switch, this time from Yahoo to Adsense at the beginning of April. We made the switch due to our dissatisfaction with the relevance of Yahoo’s ads, as well as cost-per-click levels which were sub-twenty cents. We will continue to dynamically adjust to changes in the contextual ad market.

Text link advertising remains the stalwart of our topline, but it experienced a diminution. We sold a full load of Text Link Ads inventory in the second quarter. Subsequently, management determined that a substantial portion of that ad inventory was being delivered at sub-market rates with unreasonable contractual terms. We elected to reduce the ad inventory sold through that channel from 10 links to 1 link. This had a negative $350 impact on our topline. Management believes it is in Long or Short’s long term best interest to hold back supply while pushing for Google Page Rank 6, and then seek out premium pricing selectively. If you have the ability to link to us or coerce high page rank friends to link to us, this will help greatly in our efforts to achieve Page Rank 6, and only further the growth the amount of money we dividend to our readers and get us a step closer to feeling ok buying iPhones for our children’s stuffed animals.

We had one successful CPA campaign which we launched late in Q2 with Everybody’s Gonna Get Laid Except You and followed with “Buy Your GF Flowers Now. Get It Done“.

Our subscribership increased from 508 to 1012. Approximately half that is organic growth and half that resulted from a change in the way Google Reader shows up in susbscriber stats, namely that it does show up now.

Our free cash flow is something I am really proud of and thanks to the good work our finance department did in reaching out and shaking changes out of our customers (laughs), those slow paying mother (expletive), (laughs) (inaudible), we generated free cash flow of $1,417, an increase of 200% sequentially, and higher than our cumulative free cash flow up until the beginning of this quarter. We set a target on last quarter’s call for working capital to run in the 30-35% range and we like the progress we were able to achieve in just one quarter. We are exploring uses for our cash which include but are not limited to investments in regional financial humor producers, acquisition of competitors, complicated structures involving SPEs that would allow us to mislead potential investors, or one really nice corporate pen.

Transition doesn’t sound sexy, but let me tell you, it will be. By way of example, we are like that 7 coming out of college, you know the one, brunette with an ok body ok face and has never really put it altogether. Two years out of college, she is exercising twice a day, not-eating three healthy meals a day, she blondes her hair and learns how to get it done with makeup, and now she is a 9 plus and everyone is bidding up her assets. And how does she get that done? She transitions. And that is what Long or Short is doing, transitioning. Thanks for your time, and have a great night.”

Top Articles from the Third Quarter

  1. Four Simple Steps to Becoming a Thousandaire
  2. Jacob, Son of Isaac, the First Value Investor
  3. Adjusted GPA on a Pro Forma Basis
  4. Pomegranate Capital Thinks Women Can Run Money Better Than Men, Is Wrong
  5. Crazy Person or Bluetooth Headset?: The Home Game
  6. The Market, She’s a Bitch
  7. Dogs Can Smell Fake DVDs and Other Malaysian Lies

Top Articles from the Second Quarter

  1. Vertizontal Consolidation
  2. Stop Global Warming, Make Emissions More Delicious
  3. 2×2 Matrix: Less is More
  4. Accounting in My Refrigerator
  5. Joe Theismann Presents Monday Morning Investing
  6. Critical Mass Supplier
  7. Kaiser Falcon Eyes

Note that the financials below are unaudited and may contain non-GAAP measures. All numbers comply with Seldom Accepted Accounting Principles (SAAP).

Unaudited Financial Results for Q3’07
Income Statement

Contextual CPC Revenue $229
CPA Revenue $109
Static Ad Revenue $594
Other Revenue $15

Total Revenue $947

Cost of Sales $19.55
SAAP Income $926.9

Balance Sheet

Cash $1962
Accounts Receivable $302
Inventory $0.00
Prepaid Marketing/Hosting/Reg $146
Accounts Payable $0

Cash Flow Statement

Operating Cash Flow $1417
Capex $0.00
Dividends $X.00

Performance Metrics

Visits 65,290
Pageviews 133,960
Clicks on ads 282
Subscribers by Email 159
Subscribers by XML 853
Inbound Links per Technorati 394 from 148 Sites
Technorati Rank 27,274
Inbound Links per Google ~399 sites
Google PageRank 5

Past Results (due to our reliance on SAAP, previous unaudited financial results are not reliable)
Long or Short Capital Q1’06 Results
Long or Short Capital Q2’06 Results
Long or Short Capital Q3’06 Results
Long or Short Capital Q4’06 Results
Long or Short Capital Q1’07 Results
Long or Short Capital Q2’07 Results

Also here is a look at our Google Spreadsheet Financials spread out quarterly. As you can see, we strictly adhere to SAAP.


Long or Short Capital Reports Q2’07 Results

Long or Short Capital’s fiscal 2nd Quarter ended on 1/31/07, and the company reported its results in a press release:

Mr Juggles: “Good afternoon everyone, let me first state:

‘WOW we really killed it’.

Second, let me welcome everyone on the line to hear me talk about our 2nd consecutive best quarter ever. In the Q1 call, I let you know that we had been internally focused on the so-called “sequential same store traffic figure” and we delivered a “Googlesque” 146%; this quarter we delivered a 50% increase in SSST on top of that that elevated level. I’d like to reiterate the fact that we really killed it and you should say things like “Great quarter guys” and “Thanks for letting me talk in this Q&A, I promise to ask ticky tacky irrelevant questions to perfect my model and not any questions about your sketchy use of SAAP”.

But this quarter was not all about traffic. Our new primary internal focus was on a metric known as the “Eyeball Monetization Conversion” ratio. It’s a proxy for Long or Short’s efficiency at turning our readers into dollars. Last quarter our EMC ratio was $8.43 per thousand readers — note this is not based on page views; this quarter we launched initiatives and improved our mix to drive our EMC to $18.39. None of our competitors can say the same thing, proving that we have maintained our best in class performance.

We generated earnings per subscriberholder of $2.12 compared to $0.60 in Q1’07 and $0.38 in Q4’06. We generated $1,150 in revenue for the quarter, a 489% increase YOY, and 228% sequentially. We re-experimented with Adsense starting in October, and while we eked out decent performance through December, revenue per a click fell off a cliff in January forcing us to switch our ad sourcing back to the Yahoo! Publisher platform. Our timing turned out to be perfect as our revenue per click increased by 3-4x while our CTR increased reasonably, the latter more unexpected than the former. Text link advertising became the stalwart of our topline, although a smaller % contribution than expected. We sold all our inventory for the first time to date and are positioned for a round of price increases. We also exceeded expectations in some of our one-off initiatives including “Operation Sell Our Christmas Spirit Through Amazon.com” and our late in the month experimentation with CPA ads for Valentine’s Day.

Our subscribership increased from 381 to 508.

Our free cash flow took a big hit from working capital, which was unavoidable due to our topline growth. At 81.5% of sales, this is an area we know we need to improve and I’m confident we have the people in place to get it done and effect the necessary changes. Three weeks into February, we have already made headway towards this goal. We want to be at 30-35% of sales maximum.

We had our best quarter ever in terms of revenue, free cash flow and qualifying traffic. This may sound familiar because I said the same exact thing last quarter. Let me tell you something, I really hope to be on this call with you guys and gals three months from now saying the same exact thing for the third time in a row. Thanks for your time, and have a great afternoon.”

Note that the financials below are unaudited and may contain non-GAAP measures. All numbers comply with Seldom Accepted Accounting Principles (SAAP).

Unaudited Financial Results for Q2’07
Income Statement

Contextual CPC Revenue $239.24
CPA Revenue $120.32
Static Ad Revenue $783.41
Other Revenue $8

Total Revenue $1,150.97

Cost of Sales $19.55
One Time Charge $45.00
Marketing Expense $7.55
Operating Income $1,078.87

Balance Sheet

Cash $557.55
Accounts Receivable $787.43
Inventory $0.00
Prepaid Marketing/Hosting/Reg $150.95
Accounts Payable $0

Cash Flow Statement

Operating Cash Flow $470.70
Capex $0.00
Dividends $X.00

Performance Metrics

Visits 62,570
Pageviews 134,555
Clicks on ads 313
Subscribers by Email 109
Subscribers by XML 399
Inbound Links per Technorati 461 from 132 Sites
Technorati Rank 25,370
Inbound Links per Google ~367 sites
Google PageRank 5

Past Results (due to our reliance on SAAP, previous unaudited financial results are not reliable)
Long or Short Capital Q1’06 Results
Long or Short Capital Q2’06 Results
Long or Short Capital Q3’06 Results
Long or Short Capital Q4’06 Results
Long or Short Capital Q1’07 Results


Long or Short Capital Reports Q1’07 Results

Long or Short Capital’s fiscal 1st Quarter ended on 10/31/06, and the company reported its results in a press release:

Mister Juggles: “Good morning everyone, let me welcome everyone on the line to hear me talk about our best quarter ever. Last call I introduced you to what I think is a really swell statistic, sequential same store traffic, and I put it forth as the key metric we use internally to gauge our success. Last quarter the figure was a strong 21%; this quarter that metric came in at a Googlesque (google that word with MSN Search or Yahoo if you don’t know what it means) 146%. When you consider that 146% came on top of a 21% comp, you really see the power of our model. We have maintained the highest same store traffic rate of the entire Online Financial Humor/Abstract Investment Recommendation Industry.

We generated earnings per subscriberholder of $0.60 compared to $0.38 in Q4’06 and $0.32 in Q3’06. We generated $350 in revenue for the quarter, a 222% increase YOY, and 178% sequentially. We continue to faces headwinds in our contextual advertising due to low click through rates and our experiment with Adsense has yielded lower than historic ECPM’s, but we leveraged our increased traffic volume to increase segment revenue 185% on a sequential basis.

Our strategic focus has been on growing our static ads, specifically the text link ads. Text link advertising accounted for 40% of our Q1’07 revenue, and on a runrate basis, it should rise to 50%+. This revenue is such a focus to us because of how the associated revenue tends to be recurring and very sticky, while the ads themselves are unobtrusive. Our subscribership increased from 282 to 381.

We continue to work on getting better payment terms from our ad vendors; we have had some challenges in this sector with some of suppliers of static ad inventory but we are optimistic that we can bring working capital down to 10-15% of sales. Historically, it has ranged from 25-35% of sales. In terms of liquidity, we reduced our PIK (“Payment-in-kind”) debt to zero and now have cash on the balance sheet of $114.38, despite working capital being relatively flat.

We had our best quarter ever in terms of revenue, free cash flow and qualifying traffic. We think we have established the platform both operationally and financially to build an online powerhouse, and our goal is to do 5-7% better than your expectations every day, on every post and in every quarter. If not, we will cook the books to make you think we did that.

Note that the financials below are unaudited and may contain non-GAAP measures. All numbers comply with Seldom Accepted Accounting Principles (SAAP).

Unaudited Financial Results for Q1’07

Income Statement

Contextual CPC Revenue $109.45
Static Ad Revenue $214.33
Other Revenue $27.31

Total Revenue $351.09

Cost of Sales $19.55
Marketing Expense $100.15
Operating Income $231.39
Balance Sheet
Cash $114.38
Accounts Receivable $140.36
Inventory $0.00
Prepaid Marketing/Hosting/Reg $163.05
Accounts Payable $0
Cash Flow Statement
Operating Cash Flow $222.17
Capex $0.00
Dividends $X.00
Performance Metrics
Visits 16,900
Pageviews 31,850
Clicks on ads 100
Ad impressions served 55,000
Subscribers by Email 68
Subscribers by XML 313
Inbound Links per Technorati 345 from 65 Sites (+65 on Blogger)
Inbound Links per Google ~214 sites (plus 62 on Blogger)

Past Results (due to our reliance on SAAP, previous unaudited financial results are not reliable)
Long or Short Capital Q1’06 Results
Long or Short Capital Q2’06 Results
Long or Short Capital Q3’06 Results
Long or Short Capital Q4’06 Results


Long or Short Capital Reports Q4’06 and FY’06 Results

Long or Short Capital’s fiscal 4th quarter ended on 7/31/06, and the company reported their results for both Q4’06 and FY’06 in a press release on their site:

Mister Juggles: “Long or Short had 4th quarter performance in line with management’s expectations for the slower summer months. Sequential same store traffic of 21%. This is the key figure I would like to share with you in today’s call, and while there are other figures that would show what we have done, these figures would be much more ambiguous, some could even be used to make our results look “not so hot.” Sequential same store traffic is a like-for-like measure of our number of visits in Q4 compared to Q3. As you can see, we were 21% more trafficked than last quarter, a growth rate which is the best in the Online Financial Humor/Abstract Investment Recommendation Industry.

We generated earnings per a subscriberholder of $0.38 compared to $0.32 in Q3. Our accounts receivable is a little higher than we’d like it to be due to unfavorable payment terms and a one-off timing issue with one of our largest accounts. Working capital was also challenged by our securing of a 5 year extension of our domain registry costs, which was payable up front. Revenue was flat sequentially but our reliance on Yahoo CPC advertising has been reduced and our runrate revenue should be at a higher level. In the Yahoo segment, our click through rate increased 20% sequentially, but that gain was offset by a 34% decrease in our revenue per click. Our suscribership increased from 161 to 282.

We now have $115.56 of Payment-in-Kind (PIK) debt which is off-balance sheet and was previously undisclosed. Management has experience operating in a leveraged environment, and the debt should be reduced substantially by the end of Q1’07 from working capital.

We passed several milestones in our first year, including our 30,000th visit to our new storefront, as well as 100,000th visit overall. We also fell in love. We hope that in the coming year we can repeat what we did well last year, and improve on it, by approximately 5-7% in every measure.

Note that the financials below are unaudited and may contain non-GAAP measures. All numbers comply with Seldom Accepted Accounting Principles (SAAP).

Unaudited Financial Results for Q4’06

Income Statement

Contextual CPC Revenue $38.47
Static Ad Revenue $78.50
Other Revenue $14.11

Total Revenue $126.08

Cost of Sales $19.55
Marketing Expense $0.10
Operating Income $101.43

Balance Sheet
Cash $0
Accounts Receivable $190.14
Inventory $0.00
Prepaid Hosting/Reg $115.05
Accounts Payable $0
Cash Flow Statement
Operating Cash Flow ($34.83)
Capex $0.00
Dividends $X.00
Performance Metrics
Visits 16,900
Pageviews 31,850
Clicks on ads 100
Ad impressions served 55,000
Subscribers by Email 50
Subscribers by XML 232
Inbound Links per Technorati 154
Inbound Links per Google ~71 sites

Past Results (due to our reliance on SAAP, previous unaudited financial results are not reliable)
Long or Short Capital Q1’06 Results
Long or Short Capital Q2’06 Results
Long or Short Capital Q3’06 Results


Long or Short Capital Reports Q3’06 Results

Long or Short Capital’s fiscal 3rd quarter ended on 4/30/06, and the company reported their results in a press release on their site:

Mister Juggles: “Following our best quarter ever, Q3’06 occurred amongst a background of industrial turmoil, rising oil prices, the month of March and global uncertainty. In that context, we are satisfied with our results and if we continue to pour our beakers full of managerial brilliance into this frankenstein we are confident that our Q2 performance will be more predictive of our future results than Q3. While management’s options were underwater at quarter end, a board approved “Put the Options Back in the Black” KERP plan was initiated ensuring that management will continue to be properly incentivized.

We generated cash earnings per a subscriberholder of negative $0.22 a positive increase of negative 46% over last quarter. We were cash flow positive for the 1st time in history with $35.14 of cash flow before dividends and tax distributions; this is mainly attributable to an improvement in working capital. Revenue decreased 38% sequentially, but increased Div/0% year-over-year. We faced both a 50% decrease in our click through rates for our contextual advertising and a 50% decrease in revenue per click. Our suscribership increased from 85 to 161, almost doubling.

Operation Sir-Click-A-Lot was an abject failure, and had no effect on our top line. Traffic wise we performed in line with expectations. The first full quarter at our new storefront @ longorshortcapital.com has proven to be all we expected, and its strategic location between longorshortcapitak.com and longorshortcapitam.com has given us a steady flow of captive readers.

Note that the financials below are unaudited and may contain non-GAAP measures. All numbers comply with Seldom Accepted Accounting Principles (SAAP).

Unaudited Financial Results for Q3’06

Income Statement

Contextual CPC Revenue $71.58
Static Ad Revenue $38.02
Other Revenue $11.00

Total Revenue $120.60

Cost of Sales $15.00
Marketing Expense $50.00
Operating Income $55.60

Balance Sheet
Cash $55.83
Accounts Receivable $88.10
Inventory $0.00
Prepaid Hosting $30.00
Accounts Payable $0
Cash Flow Statement
Operating Cash Flow $82.96
Tax Distributions to Partners $80.00
Capex $0.00
Dividends $X.00
Performance Metrics
Visits 13,950
Pageviews 26,150
Clicks on ads 90
Ad impressions served ~43,874
Subscribers by Email 34
Subscribers by XML 127
Inbound Links per Technorati 108
Inbound Links per Google ~40 sites

Past Results
Long or Short Capital Q1’06 Results
Long or Short Capital Q2’06 Results


Next Page »